Fully integrated reliability and safety software for the professional.
- Reliability block diagram analysis
- Fault tree, common cause and importance analysis
- Event tree analysis with multiple risk categories
- Markov analysis including multi-phase modelling
- Link hazard logs and requirements to RBD or fault tree verification models
- Multiple standards support for system analysis including ARP 4761, IEC 61508, ISO 26262
- Predict the reliability of electronic and mechanical components using MIL-217, Quanterion 217 Plus, SN29500, IEC 61709, FIDES, Telcordia TR/SR, IEC TR 62380, GJB299C and NSWC
- FMEA and FMECA to standards such as MIL-STD-1629A, BS 5760 Part 5, GJB 1391-92, AIAG & VDA, SAE J1739, ARP5580
- Link to Requirements Management tools such as Jama Connect®
Our software has been in continuous development since the 1980s and is the recognized standard for safety and reliability professionals.
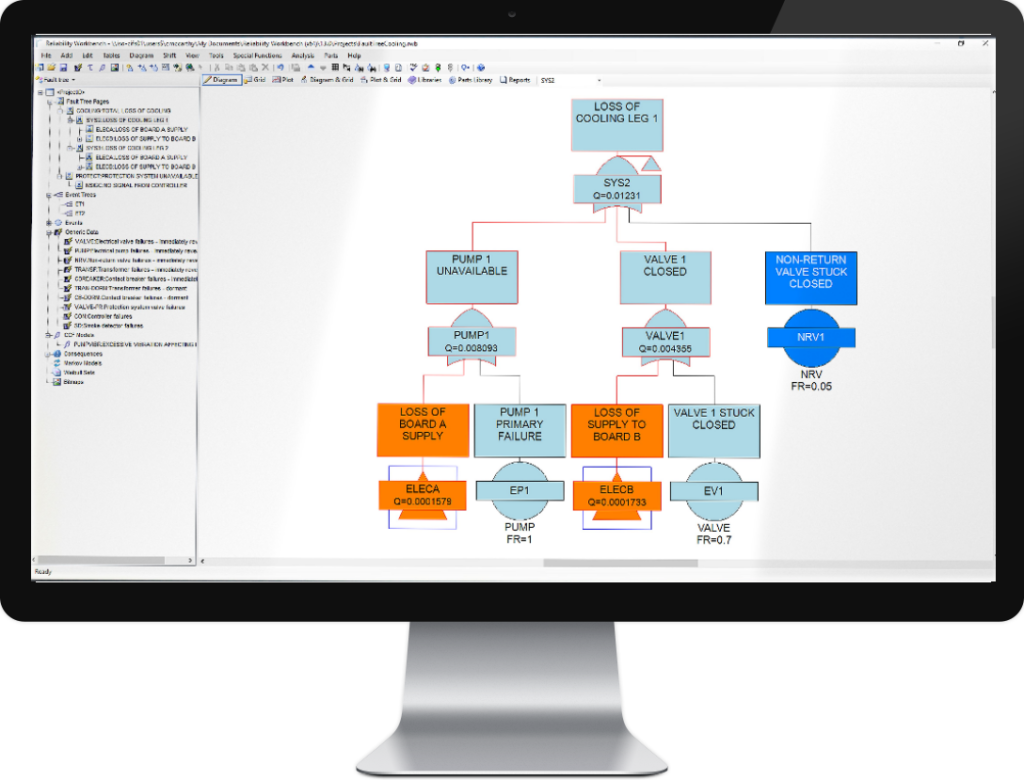
Why choose Isograph's Reliability Workbench?
Accurately Predict System Reliability
Our powerful minimal cut set generator ensures that dependent RBD, fault and event tree structures are modelled efficiently and accurately. Determine the reliability and availability of complex systems and identify weak points with importance analysis
Highly Integrated Data and Methods
Link RBDs and fault trees to prediction, FMEA, Markov models, failure data libraries and hazard logs for safety assessment verification. Attach fault trees to event trees for risk analysis
Enterprise Level Safety Analysis
Perform safety analysis at an enterprise level using the Isograph Enterprise Database. Maintain projects and libraries in a security controlled environment
Modules in Reliability Workbench
- Prediction
- Fault Tree
- Reliability Block Diagram Analysis
- FMECA
- Event Tree Analysis
- Weibull Analysis
- Markov Analysis
- Reliability Growth
- Reliability Allocation
- Safety Assessment
Powerful simulation software for improving asset performance. Maintenance and spares optimization, availability studies, reliability centered maintenance, life cycle cost evaluations and accelerated life testing all in one integrated suite.
- Connect directly to your SAP or MAXIMO system and analyze your data
- Identify critical equipment
- Automatically build failure models using Weibull analysis
- Optimize your maintenance plans using simulation and reduce costs
- Predict system availability and optimize your design
- Simulation of multiple-product capacity with target cost penalties
- Model system dependencies with RBDs or fault trees
- Build in operational rules for accurate performance simulation
- Determine the most effective spares holding policy
- Predict life cycle costs
- Analyze your test data for stressed failures in the ALT module
- Identify plant performance trends in the Process Reliability module
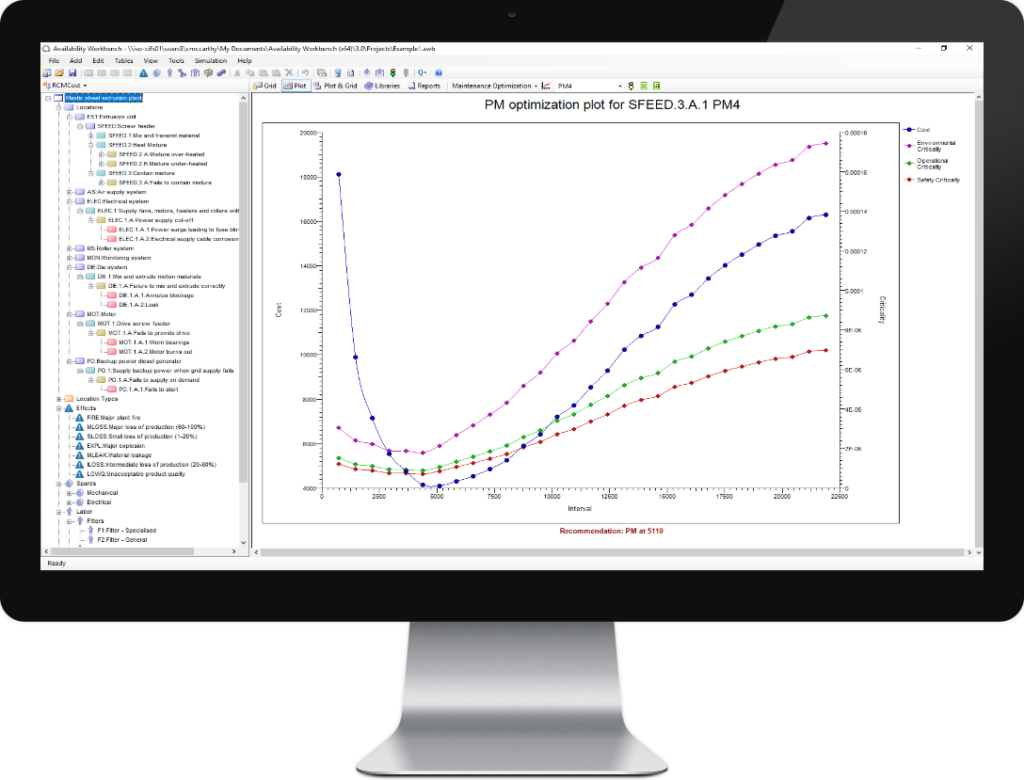
Why choose Availability Workbench
Reliability Centered Maintenance
Availability Workbench applies Reliability Centered Maintenance (RCM) procedures for optimizing maintenance strategies based on reliability techniques and encompasses well-known analysis methods such as Failure Mode Effects and Criticality Analysis (FMECA)
System Availability Simulation
The Availability Simulation (AvSim) module is a powerful system reliability and availability simulator. It is capable of analyzing complex and dependent systems, and allows you to predict capacity and availability as well as identify system weak spots.
Enterprise Level
Perform maintenance optimization and system availability simulation at an enterprise level using the Isograph Enterprise Database.
Modules in Availability Workbench
- RCMCost
- AvSim
- Weibull
- Life Cycle Cost
- Process Reliability
- SAP Portal
- Maximo Portal
- Accelerated Life Testing
The Network Availability Prediction program enables users to predict the availability and reliability of communication networks. The Network Availability Prediction network block diagram model utilizes an extended Reliability Block Diagram (RBD) methodology that addresses the specific characteristics of network elements and their connections.
- Create clear, concise diagrams
- Model complex networks
- Import/export facilities to databases and spreadsheets
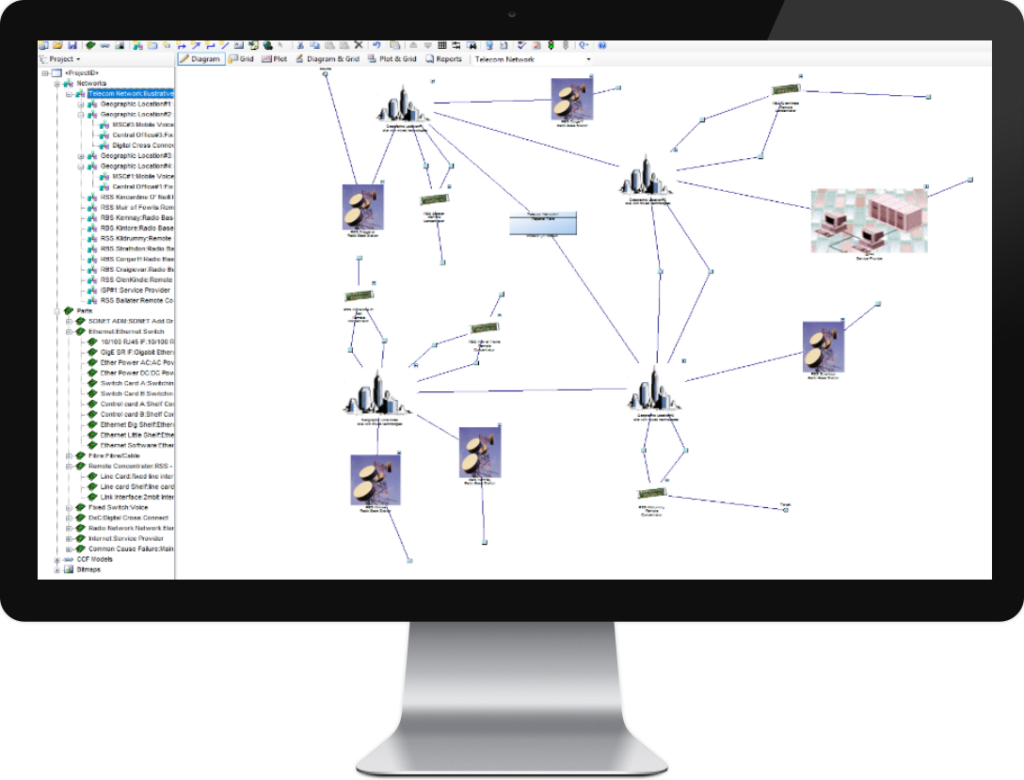
Why choose NAP
Model Complexity
Complex or simple networks may be modeled using Network Availability Prediction. Network elements may be logically modeled right down to part level using the powerful Network Availability Prediction pagination facility. Individual network element diagrams have been extended beyond traditional RBDs to allow users to model multiple interfaces and their interactions with common equipment.
Clever Pathfinder
Network Availability Prediction will then automatically determine the allowable paths between a source and target, and hence determine the minimal cut sets that determine the availability of the network..
Time Saving
Network Availability Prediction provides many time-saving features to allow users to quickly construct the network diagram. These include a parts library facility that allows users to import their parts data in convenient groupings, a network element library facility that allows users to construct common network element diagrams and a fully interactive network diagram construction facility
Model system vulnerability, identify weakspots and improve security using threat analysis and attack trees. Construct graphical representations of measures designed to reduce the consequences of a successful attack with mitigation trees.
- Analyze threats according to standards such as ISO 26262, ISO/SAE 21434, J3061, DO-356 and ED-203
- Identify where your system is vulnerable to an attack
- Improve the security of your assets and IT systems
- Model consequence mitigation
- Build models quickly using the advanced GUI features of AttackTree
- Link to Requirements Management tools such as Jama Connect®
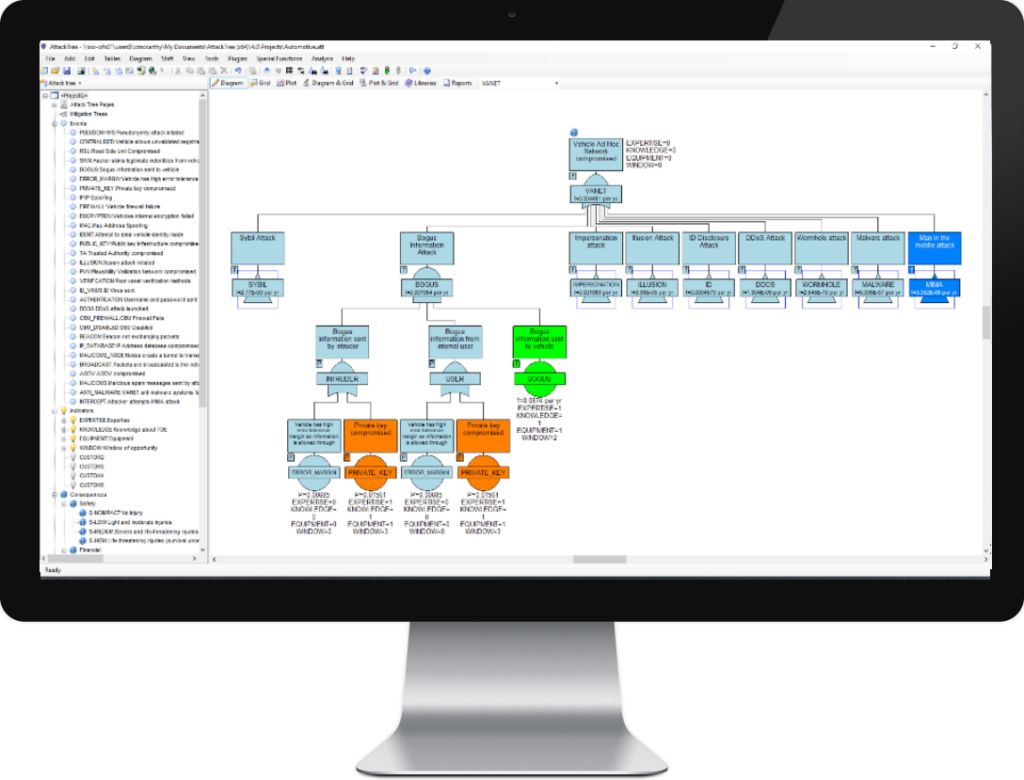
Why choose AttackTree
Consequence Driven AttackTrees
AttackTree allows users to define consequences and attach them to any gate within the attack tree. In this way, it is possible to model the consequences of successful attacks on the target system.
Threat Analysis and Risk Assessment
Perform threat analysis and risk assessment according to well-known standards such as ISO 21434, SAE J3061 and ISO 26262 Read More On Cyber Security Analysis Read More On Threat Analysis
Mitigation Trees
Mitigation trees may be used to model the effects of mitigating measures on the consequences resulting from a successful attack
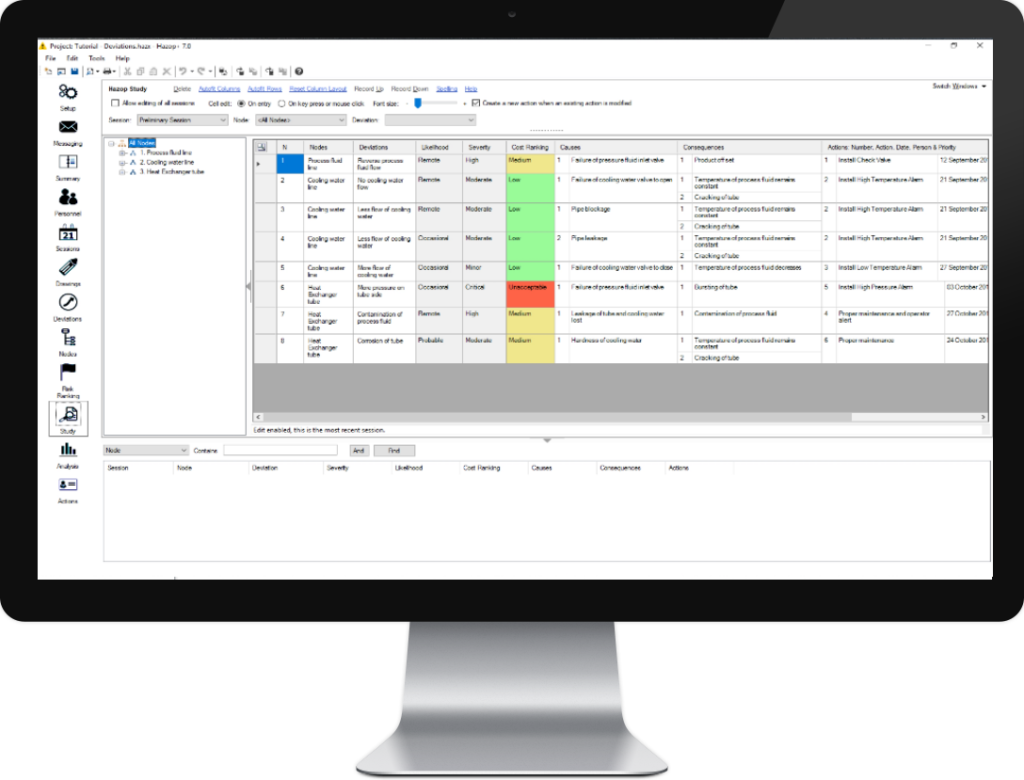
Hazop+, Isograph’s powerful Hazop software, can be used to vastly simplify the customizing, recording, managing and reporting processes of the Hazop study. This means a Hazop study can be completed much more quickly and cost-effectively.
- Create Risk ranking matrices
- Quickly enter hazop study records
- Log meetings and easily assign & view actions
Why choose Hazop+
Everything in one program
With Isograph’s Hazop software you no longer need to have numerous documents / paper based sheets or other items you can easily lose track of, everything is stored in one easy to view, edit and manage project.
Hazop Designed Focus
Isograph’s Hazop software was designed simply with a Hazop in mind. No complicated extras, no confusing add-ons. Hazop has simplicity at its core. Easily view, track and manage actions assigned to members of staff.
Customizable
Edit deviations, guide words and parameters, create custom fields to tailor your hazop to your own personal needs.
Link – www.isograph.com
